


Financial Profile
For the fiscal years ended March 31
(Millions of Yen)
|
2008
|
2009
|
2010
|
2011
|
2012
|
|
|---|---|---|---|---|---|
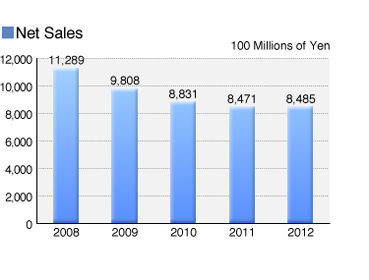
| Net Sales | 1,128,875 | 980,803 | 883,086 | 847,105 | 848,548 |
| Costs of sales | 619,371 | 519,523 | 474,801 | 459,420 | 464,743 |
| Gross profit | 509,504 | 461,280 | 408,285 | 387,685 | 383,805 |
| S.G.A. Expenses | 396,678 | 418,558 | 347,125 | 349,306 | 348,287 |
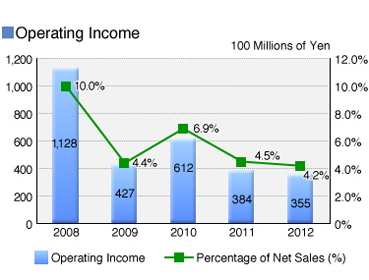
| Operating income | 112,826 | 42,722 | 61,160 | 38,379 | 35,518 |
| Other Income | 9,008 | 11,591 | 6,518 | 8,179 | 7,392 |
| Other Expenses | 24,522 | 28,634 | 21,603 | 23,343 | 25,045 |
| Other Income / Expenses | -15,514 | -17,043 | -15,085 | -15,164 | -17,653 |
| Extraordinary income | 4,111 | 34 | 51,986 | 6,118 | 322 |
| Extraordinary loss | 10,245 | 46,096 | 7,358 | 9,395 | 27,682 |
| Extraordinary Item | -6,134 | -46,062 | 44,628 | -3,277 | -27,360 |
| Income Before Provision for Income Taxes | 91,179 | -20,383 | 90,703 | 19,938 | -9,495 |
| Provision for Income Taxes | 36,749 | 32,525 | 38,001 | 15,625 | 39,282 |
| Minority Interests | -195 | -2,347 | 175 | 447 | 208 |
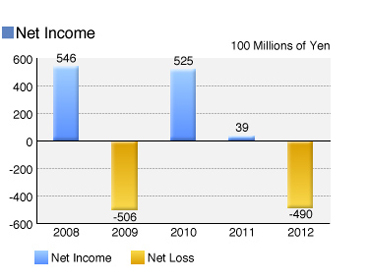
| Net Income | 54,625 | -50,561 | 52,527 | 3,866 | -48,985 |
(Note) Above consolidated statements of income are based on Japanese GAAP. Therefore, this information has some differences as to description from financial statements in annual report based on U.S. GAAP.